Calendar Heatmaps: See Your Study Consistency: AI workflows (2025)
Calendar Heatmaps: See Your Study Consistency (AI 2025)
Table of Contents
🧭 What & Why: Why Calendar Heatmaps Work
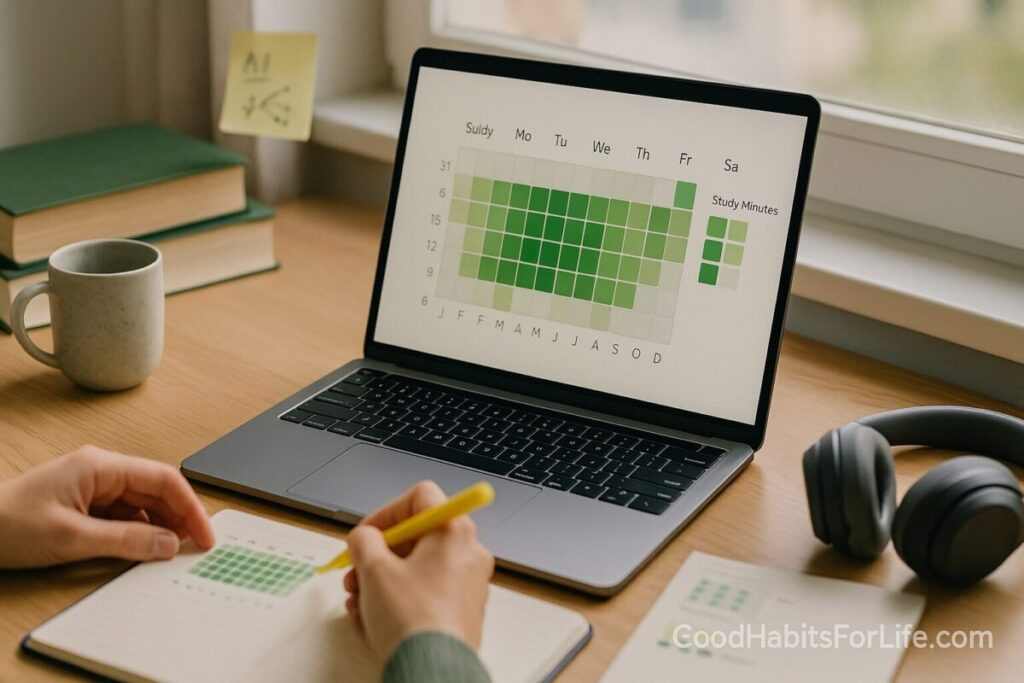
Calendar heatmaps visualize daily study minutes (or tasks completed) on a calendar grid, coloring each day by intensity. One glance shows streaks, slumps, and seasonality—turning “I think I studied a lot” into objective evidence.
Why this helps learning:
-
Progress monitoring boosts goal attainment—especially when tracked and recorded. A large meta-analysis found bigger effects when progress is physically recorded and/or shared. American Psychological Association
-
Self-regulated learning improves when learners set goals, self-monitor, and reflect; the heatmap is a reflection cue. PMC+1
-
Spacing & retrieval: Seeing gaps reminds you to space reviews and use testing, which research shows are among the highest-utility strategies for durable learning. SAGE Journals+1
-
Interleaving: Alternating topics day-to-day improves discrimination and retention; heatmaps help you plan those alternations across weeks. SpringerLink+1
-
Habit formation takes time (often ~66 days median). Visual streaks keep motivation alive during the early, fragile weeks. Wiley Online Library
✅ Quick Start (Do This Today)
-
Choose your metric
-
Start with Study Minutes per day. Add optional flags: subject, method (read, recall, problem sets), difficulty.
-
-
Define traffic-light thresholds
-
Red < 25 min, Yellow 25–44, Green ≥ 45 min (or adjust to your schedule).
-
-
Log today
-
Use your phone’s notes, Notion, or Obsidian. Keep it to three fields:
date,minutes,topic.
-
-
Build a quick heatmap
-
Google Sheets → paste dates/minutes → Insert → Pivot table (rows=week, columns=weekday) or use a template; apply Conditional formatting → Color scale for the grid.
-
-
Add weekly reflection
-
Every Sunday: 5-minute review. “What got me green? What caused reds? One change for next week.”
-
-
Optional: share
-
If you learn in a cohort, share your weekly heatmap thumbnail—social commitment can amplify progress monitoring effects. American Psychological Association
-
🛠️ AI Workflows (2025): From Logs → Tags → Heatmap
Below are three reliable stacks, from simple to pro. Mix and match.
1) Notion + AI + Google Sheets (no-code)
-
Capture: Notion database with properties
Date,Minutes,Subject,Method,Notes. -
Auto-tag with AI: Use Notion AI to suggest tags (e.g., “calculus, spaced-repetition, retrieval”) from your daily note. Notion+1
-
Export weekly CSV → Google Sheets and apply a calendar-style layout + color scale for a heatmap.
-
Bonus: Create a “Week in Review” page with rollups (avg minutes, % green days).
2) Obsidian + Dataview + Calendar Heatmap
-
Capture: Daily notes (
YYYY-MM-DD.md) with frontmatter: -
Query: Use Dataview to aggregate minutes by date and render a list or table; add a calendar heatmap plugin or export to CSV for Sheets. Blacksmith GUI+1
-
Why Obsidian? Local, fast, and powerful for long-term PKM.
3) Anki + Google Calendar + Dashboard (intermediate)
-
Capture automatically: Anki logs your reviews (cards/day, time spent).
-
Context link: Add a “Study” calendar event on days you review; with Google Calendar API or Apps Script, pull totals into Sheets for a calendar heatmap. Google for Developers+1
-
Alignment with learning science: You’ll literally see spaced repetition adherence day-by-day. (Anki uses SM-2/FSRS algorithms.) Anki FAQs+1
Prefer a ready-made visualization? Explore calendar heatmap components in analytics tools (Looker, Splunk) or JavaScript libraries. Looker Marketplace+1
🧠 Techniques & Frameworks That Compound Results
Spacing & Retrieval (top-tier strategies)
-
What to do: Convert readings into practice questions; schedule short reviews across days/weeks.
-
Why: Strong evidence supports practice testing and distributed practice for long-term retention. SAGE Journals+1
-
Rule of thumb: For an exam
Tdays away, review ~T × 10–20%after first study (e.g., in 30 days → review after 3–6 days). PubMed
Interleaving
-
What to do: Rotate topics (A→B→C→A…) across green days; don’t “cram one topic all week.”
-
Why: Interleaving often beats blocking in math and concept learning. SpringerLink+1
Self-Regulated Learning loop
-
Plan → Monitor → Reflect → Adapt each week. Use the heatmap as your reflection trigger. PMC
Personal Informatics stages
-
Preparation → Collection → Integration → Reflection → Action—design your workflow to pass through all five. The heatmap is the reflection artifact that drives action. Ian Li
👥 Audience Variations
Students (school/uni):
-
Aim for ≥5 green days/week during term. Interleave core subjects; pin exam weeks as “darker green” goals.
Professionals (upskilling, certs):
-
Use 45–60 min green blocks before work or at lunch; Sundays = planning + backlog triage.
Teens (with parents):
-
Keep green threshold lower at start (20–30 min). Celebrate streaks weekly; add light gamification.
Seniors / lifelong learners:
-
Prefer shorter 25–30 min green windows with daily consistency and gentle interleaving (language, memory, arts).
⚠️ Mistakes & Myths to Avoid
-
Myth: “Any streak is progress.” Only if your green threshold matches your learning goals—set it too low and you’ll stall.
-
Mistake: logging minutes without method. Tag how you studied (retrieval vs reread) to ensure quality. SAGE Journals
-
Myth: “Block one subject until mastery.” Interleaving usually helps more than marathon blocking. SpringerLink
-
Mistake: no weekly reflection. The meta-analysis shows recorded and reviewed progress works best—schedule a 5-minute review. American Psychological Association
💬 Real-Life Examples & Copy-Paste Scripts
1) AI tagger prompt (Notion/ChatGPT):
“Summarize this study log in ≤140 chars, extract topics, and label method as retrieval / problem-solving / read-review. Output CSV: date, minutes, topics, method.”
2) Weekly review script:
“What made my green days green? What patterns (subjects, times) correlate with green? One concrete change for next week is ____.”
3) Interleaving planner:
“Generate a 2-week interleaving schedule for Calculus, Physics, and Chemistry with 5×45-min sessions/week, ensuring spaced reviews (3–6 day gap).”
4) Anki + Calendar note:
“If total reviews ≥30 min, auto-create a ‘Study’ calendar event; color = green. Else yellow.”
5) Accountability nudge:
“Every Sunday 19:00, DM me last week’s heatmap caption: ‘5 green, 1 yellow, 1 red — Physics improved, Chem lagged; plan: 2 more Chem retrievals.’”
🔧 Tools, Apps & Resources (Pros/Cons)
-
Google Sheets/Apps Script — Free, flexible; quick heatmaps via conditional formatting; needs simple setup/maintenance. Google for Developers
-
Notion (Calendar + AI) — Excellent capture + lightweight AI tagging; export to CSV; great weekly dashboards. Notion+1
-
Obsidian + Dataview — Local, fast querying; ideal for power users; add plugins for calendar heatmaps. Blacksmith GUI
-
Anki (SM-2/FSRS) — Gold-standard spaced repetition with detailed logs; minimal friction once set. Anki FAQs
-
Calendar heatmap components — Ready-made visuals (Looker, Splunk); fastest to pretty charts; may require enterprise tools. Looker Marketplace+1
-
GitHub-style contribution calendar — Inspiration for streak design; public sharing boosts accountability. GitHub Docs+1
Suggested thresholds (tune to taste):
| Day Color | Minutes (default) | What it means |
|---|---|---|
| 🔴 Red | 0–24 | Missed or minimal effort; review blockers |
| 🟡 Yellow | 25–44 | Some progress; add short retrieval set |
| 🟢 Green | ≥45 | Solid session; log method + next step |
| 🟣 Deep Green | ≥90 | Deep dive; schedule next spaced review |
📚 Key Takeaways
-
Make study visible. A calendar heatmap converts feelings into facts.
-
Quality over minutes. Track methods (retrieval, interleaving) alongside time.
-
Automate with AI. Auto-tags and weekly summaries reduce admin and keep you consistent.
-
Reflect weekly. Small course-corrections beat heroic catch-ups.
-
Design for the long game. Habits compound—aim for steady greens over months. Wiley Online Library
❓FAQs
1) What should I track besides minutes?
Method (retrieval vs reread), subject, difficulty (1–5), and location/time. These context tags help you spot what actually produces green days. SAGE Journals
2) How many “green” days per week is good?
For most learners, 5 green days/week during active terms is sustainable. Professionals might target 4–5.
3) How long until I see results?
Expect noticeable retention gains within 2–4 weeks as you adopt retrieval + spacing; durable habit formation typically takes longer (median ~66 days). SAGE Journals+1
4) Is interleaving always better than blocking?
Not always, but often—especially for problem-solving domains. Try interleaving topics within a week and compare practice tests. SpringerLink
5) Can AI mis-tag my sessions?
Yes; keep the human-in-the-loop. Skim weekly tags and fix any obvious errors. The goal is directionally accurate insights with minimal effort.
6) How do I handle off days without losing streaks?
Lower the threshold to a “micro-green” (e.g., 10–15 min) on tough days so momentum continues, then rebound next day.
7) Do heatmaps replace to-do lists or calendars?
No—they complement them. Heatmaps show what happened; to-dos/calendars plan what will happen.
8) How do I build a heatmap without code?
Use Google Sheets color scales or an analytics tool with a calendar heatmap visual. Looker Marketplace
References
-
Harkin, B., et al. (2016). Does monitoring goal progress promote goal attainment? Psychological Bulletin (meta-analysis). https://www.apa.org/pubs/journals/releases/bul-bul0000025.pdf American Psychological Association
-
Panadero, E. (2017). A Review of Self-regulated Learning: Six Models and Four Directions for Research. Frontiers in Psychology. https://pmc.ncbi.nlm.nih.gov/articles/PMC5408091/ PMC
-
Dunlosky, J., et al. (2013). Improving Students’ Learning With Effective Learning Techniques. Psychological Science in the Public Interest. https://journals.sagepub.com/doi/10.1177/1529100612453266 SAGE Journals
-
Cepeda, N. J., et al. (2008). Spacing Effects in Learning. Psychological Science. https://laplab.ucsd.edu/articles/Cepeda%20et%202008_psychsci.pdf LapLab
-
Rohrer, D., & Taylor, K. (2014). The benefit of interleaved mathematics practice is not limited to superficially similar kinds of problems. Psychonomic Bulletin & Review. https://link.springer.com/article/10.3758/s13423-014-0588-3 SpringerLink
-
Li, I., Dey, A., & Forlizzi, J. (2010). A Stage-Based Model of Personal Informatics Systems. CHI 2010. https://www.ianli.com/publications/2010-ianli-chi-stage-based-model.pdf Ian Li
-
Lally, P., et al. (2010). Modeling habit formation in the real world. European Journal of Social Psychology. https://onlinelibrary.wiley.com/doi/full/10.1002/ejsp.674 Wiley Online Library
-
Paulsen, L., et al. (2024). Learning analytics dashboards are increasingly becoming about learning. Education and Information Technologies. https://link.springer.com/article/10.1007/s10639-023-12401-4 SpringerLink
-
Jivet, I., et al. (2018). License to evaluate: preparing learning analytics dashboards for educational practice. LAK/CHI Workshop. https://dl.acm.org/doi/10.1145/3170358.3170421 ACM Digital Library
-
Google Developers. Google Calendar API Overview. https://developers.google.com/workspace/calendar/api/guides/overview Google for Developers
-
Anki. What spaced repetition algorithm does Anki use? https://faqs.ankiweb.net/what-spaced-repetition-algorithm Anki FAQs
-
GitHub Docs. Viewing contributions on your profile (contribution calendar). https://docs.github.com/articles/viewing-contributions-on-your-profile-page GitHub Docs